
MAVEN Project, an organization dedicated to expanding healthcare access, needed a way to provide different user groups with clear, data-driven insights. To address this, we designed six interactive dashboards within their existing platform, allowing users to track progress and access key performance metrics. This project required a deep understanding of data visualization, user needs, and platform constraints, while also ensuring seamless integration with Power BI.

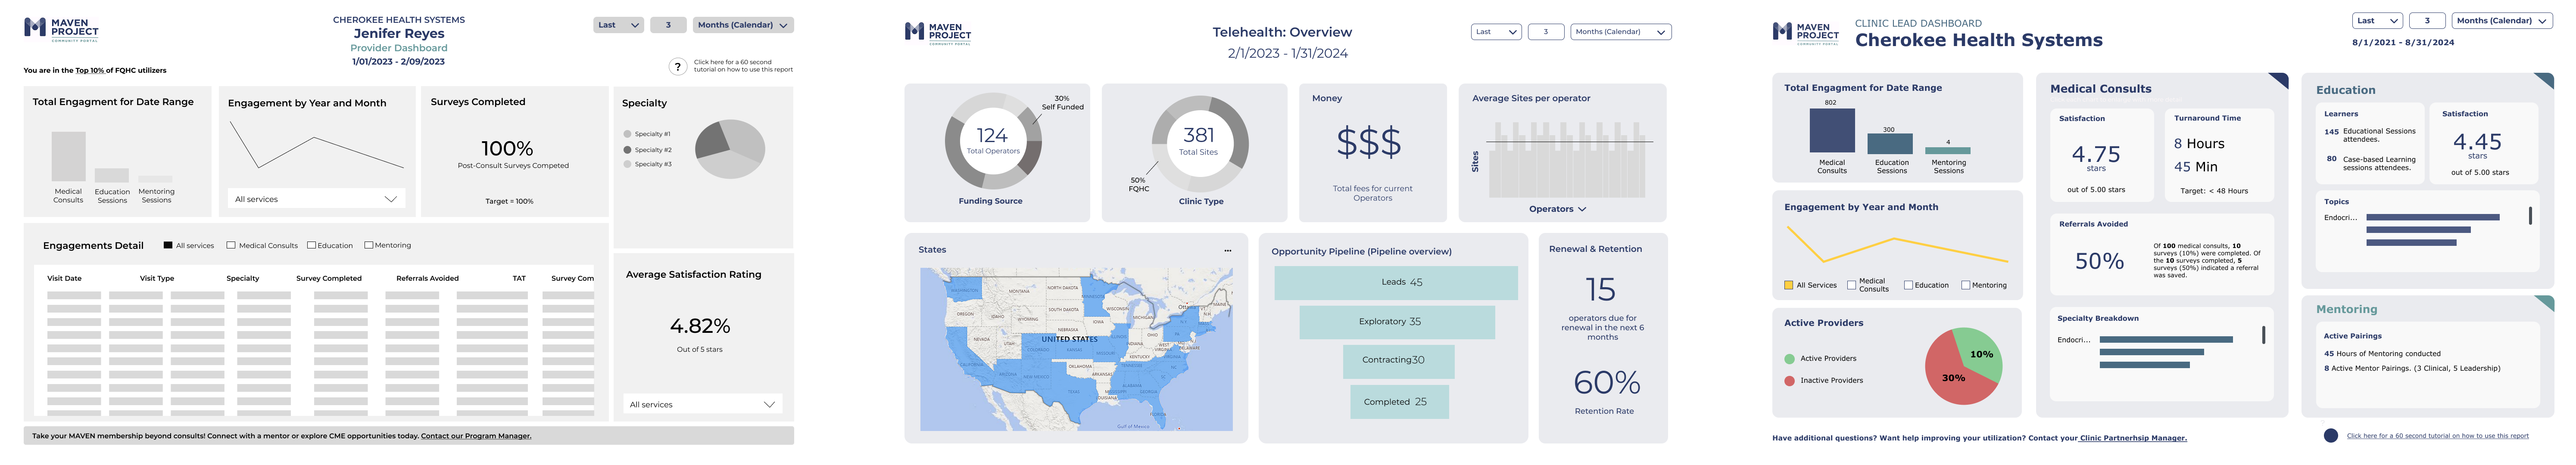
MAVEN Project, an organization dedicated to expanding healthcare access, needed a way to provide different user groups with clear, data-driven insights. To address this, we designed six interactive dashboards within their existing platform, allowing users to track progress and access key performance metrics. This project required a deep understanding of data visualization, user needs, and platform constraints, while also ensuring seamless integration with Power BI.
The MAVEN Dashboards project was my first experience designing for an app, a challenge that pushed me into the world of data visualization and backend platform integration. MAVEN Project, an organization dedicated to expanding healthcare access, needed six unique dashboards to support different user groups. These dashboards would provide users with insights into their progress and results, embedded within an existing platform.
Working alongside a project manager, a site developer, and a data engineer, I was the sole designer responsible for creating a seamless and intuitive experience. Learning to design within Power BI was a key part of this project, as well as understanding how data is structured and presented for usability. Throughout the process, I balanced this work alongside other web design projects, making time management and adaptability essential.
.png)
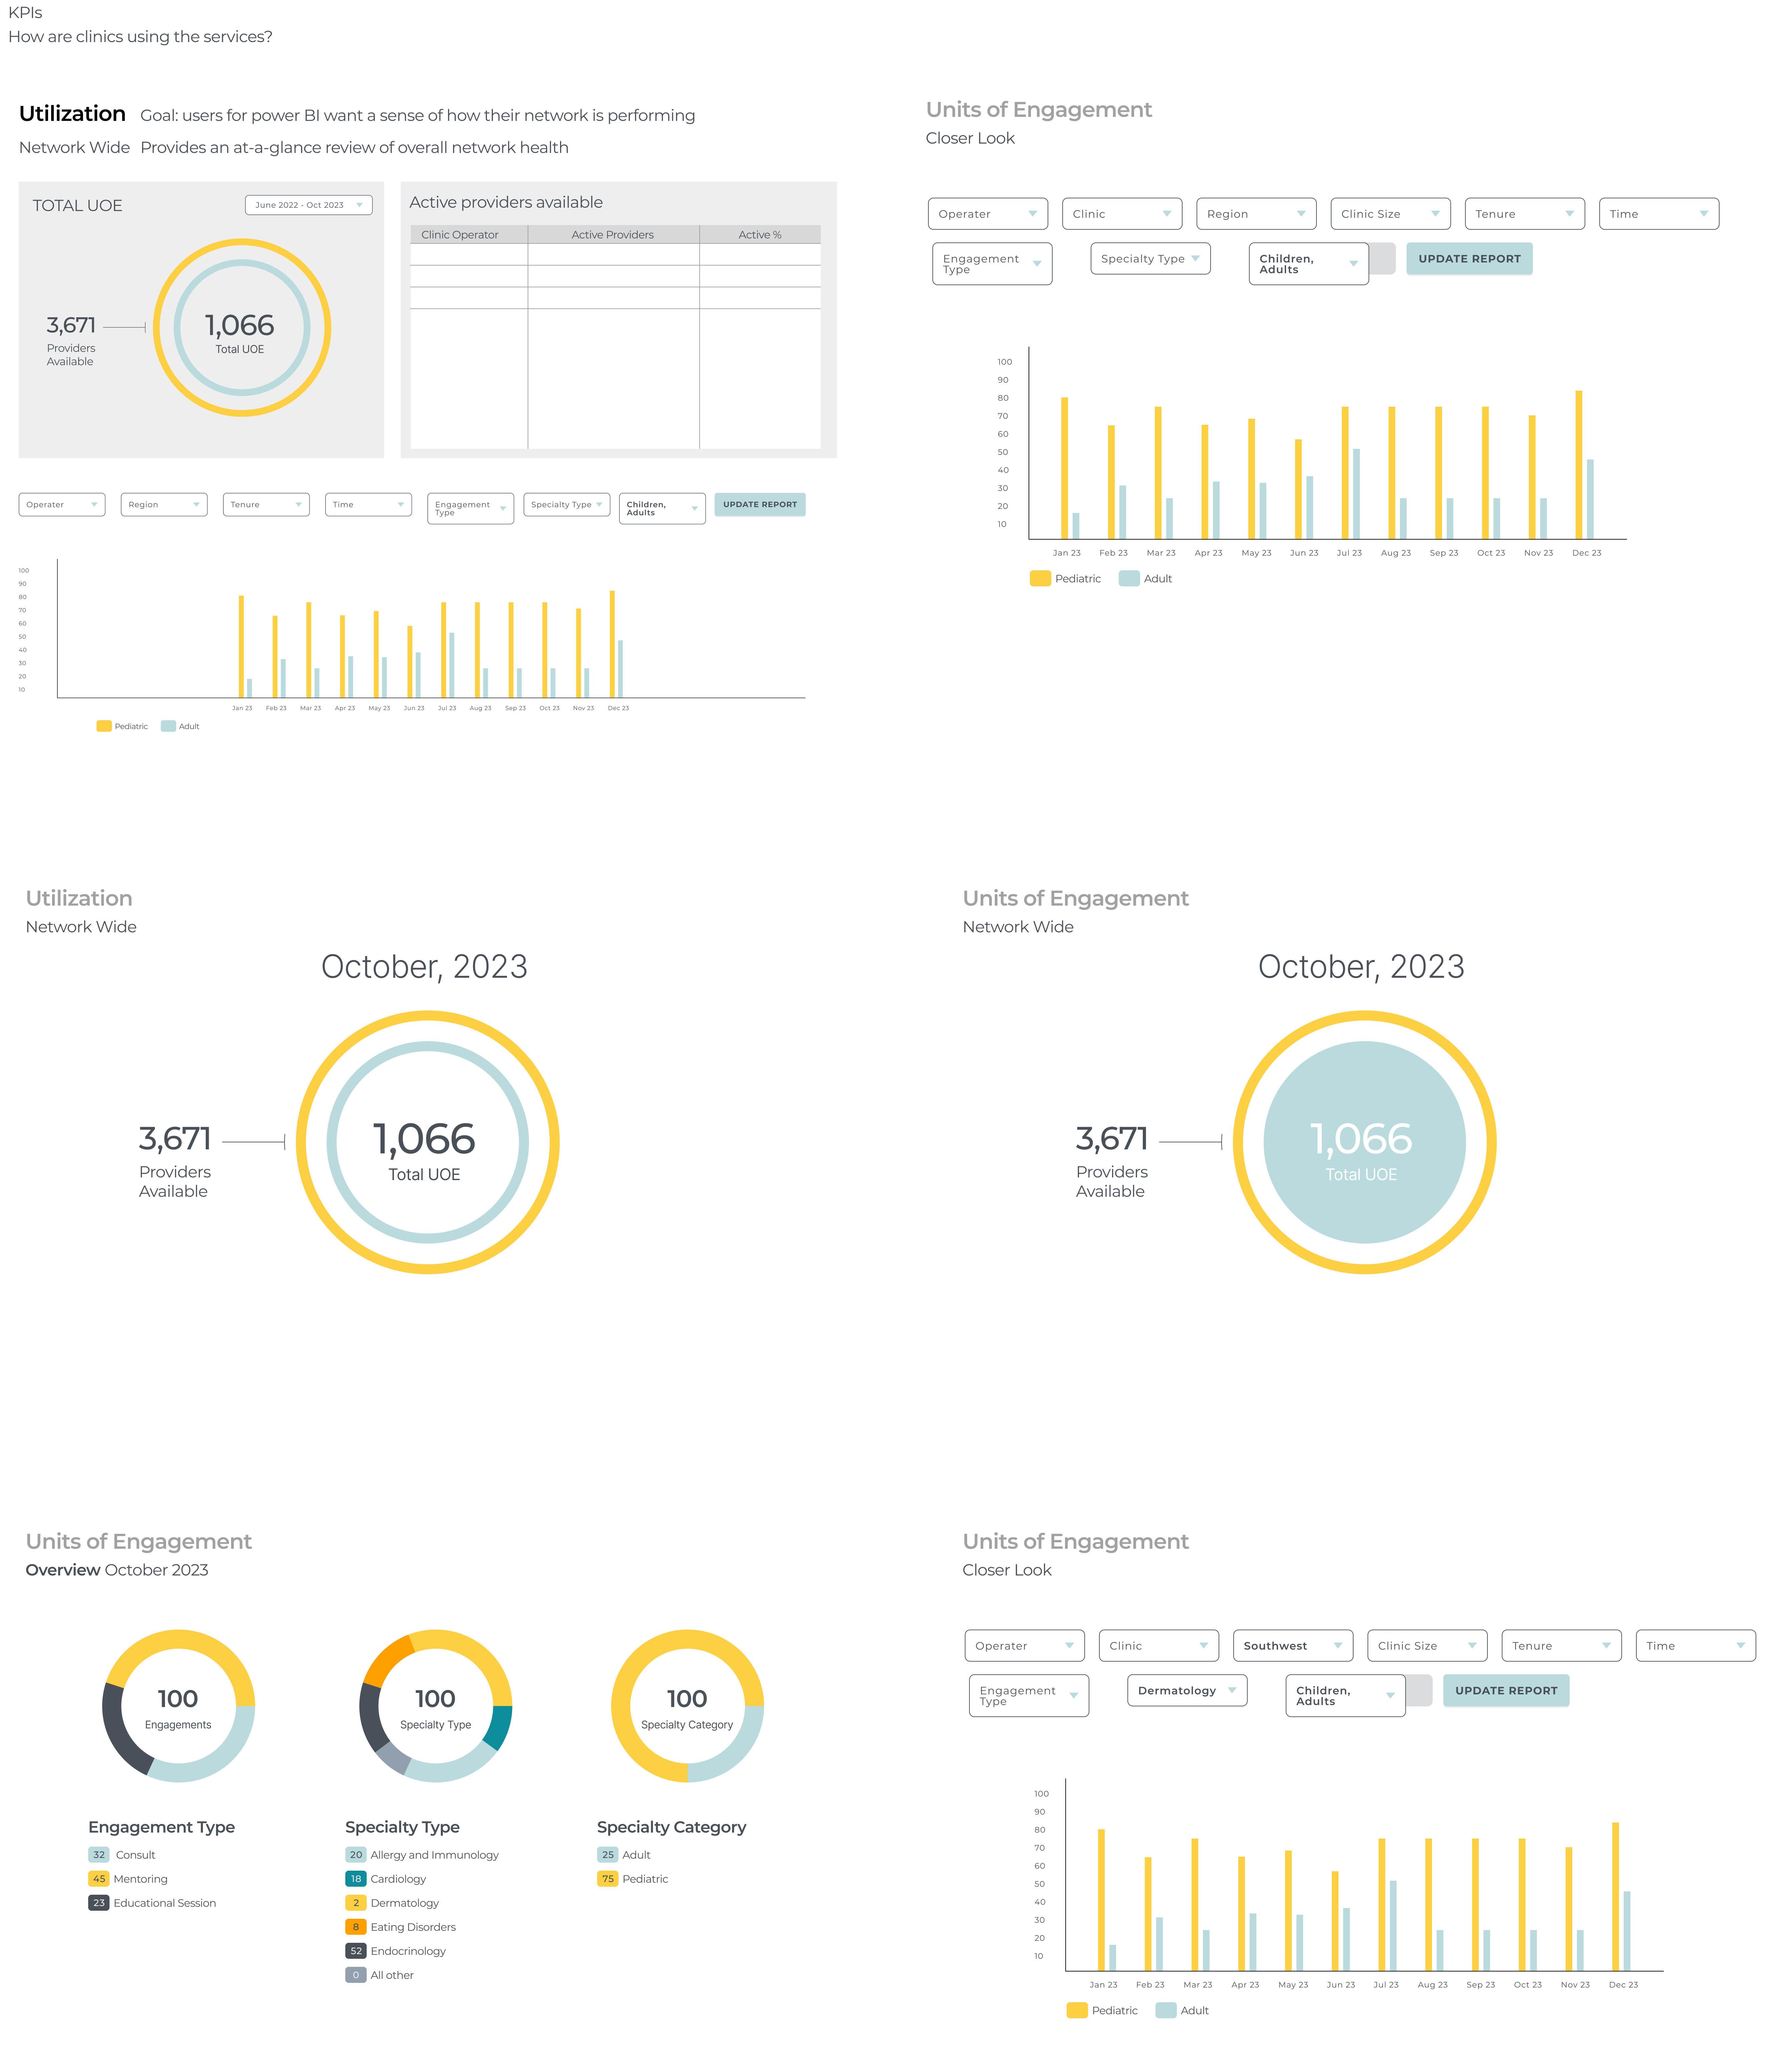
MAVEN's backend platform lacked a structured way for different user groups to track their performance and outcomes. Each group required access to specific data sets, but without an organized, user-friendly interface, extracting meaningful insights was difficult. The key challenges included:
.png)
The MAVEN Dashboards provided users with a streamlined way to track their progress and access critical insights. By tailoring each of the six dashboards to specific user groups, we enhanced efficiency and usability within the platform. The project not only improved user engagement but also strengthened my skills in data design and collaboration across technical disciplines.
Role
Tools
If you like what you see and want to work together, get in touch!
daliabolton@gmail.com